|
This is part 1 of a series of blogs on measuring risk adjusted return of a Real Estate portfolio. In this blog, we will focus on a fundamental concept around adjusting for risk to measure the performance of an asset – The Sharpe Ratio. What is Sharpe Ratio: As investors, obviously we care about expected return on say a given asset or across a given portfolio. Keeping everything else constant, higher expected return is better than lower, for instance. But just looking at the expected returns masks an important fundamental concept around the risk that we take to sustain that return. One way to measure the risk is to measure the standard deviation of the expected return. Without going into too much detail in this post, one measure of risk is the standard deviation of the return. An asset with a lower standard deviation has a more consistent return than the one with a higher standard deviation. A question arises, whether an investment in an asset with a expected return of 20% and a standard deviation of 10% is better than an investment with 30% expected return and 30% standard deviation. The second investment has a higher expected return but also a much higher standard deviation. This is where the notion of Sharpe comes in. Developed in 1966 by Nobel prize winner William Forsyth Sharpe, the Sharpe ratio measures the expected return of an asset relative to its risk. 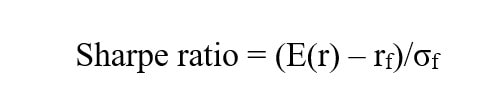 where E(r) = asset expected return, rf is the risk free rate and σf is the standard deviation of the excess return. As we can see expected return increases the Sharpe but standard deviation reduces it. In our contrived example, option one is a better investment despite having a lower expected return. This is due to the lower standard deviation of option one.
Limitations of Sharpe Ratio: The benefits of Sharpe ratio are obvious. Its a dimensionless way to compare asset returns paying regard to their risk. It establishes a benchmark across different assets and facilitates an objected comparison of return adjusted for risk. As it turns out, there are some limitations as well. One of the biggest limitations of the Sharpe ratio is that it assumes “normality”. Without going into too much detail this means that the return distribution is expected to follow a normal or a “bell-curve” distribution. While this is practically not true (asset returns need not be normal), it still isn’t too much of a limitation. There are other limitations of the Sharpe ratio as well related to the time-structure of the returns. We will not go in too much detail on those for the sake of simplicity. Suffices to that the Sharpe ratio is a great tool for the modern Real Estate investor to compare the relative performance across different investments properly accounting for the underlying risk and penalizing riskier investments versus lower risk ones and favoring investments with a higher expected return over the ones with a lower value.
0 Comments
Leave a Reply. |
Archives
November 2021
Categories |

 RSS Feed